Cockpit is a free and easy-to-use front-end server management tool that allows Linux users and system administrators to monitor and troubleshoot pesky issues on their systems. Cockpit is accessed through a web browser and its dashboard gives you a peek of your server’s health alongside other system statistics such as network usage, disk space, and utilization, current users, system uptime, running processes and system logs. Additionally, you can run administrative tasks such as enabling and disabling the firewall, creating and deleting users, installing/updating/upgrading/uninstalling software packages and even rebooting or powering off the server. You can comfortably Install Cockpit is simple and straight forward. In this guide, you will learn how to install Cockpit on CentOs 8.
By default, CentOS 8 and RHEL 8 ship with CentOS by default. But if for any reason it is uninstalled, here’s how you can install Cockpit on CentOS 8.
Step 1: Update CentOS 8
It’s always good practice to update software packages before getting started with any installation process. So, to update CentOS 8, run:
# sudo yum update
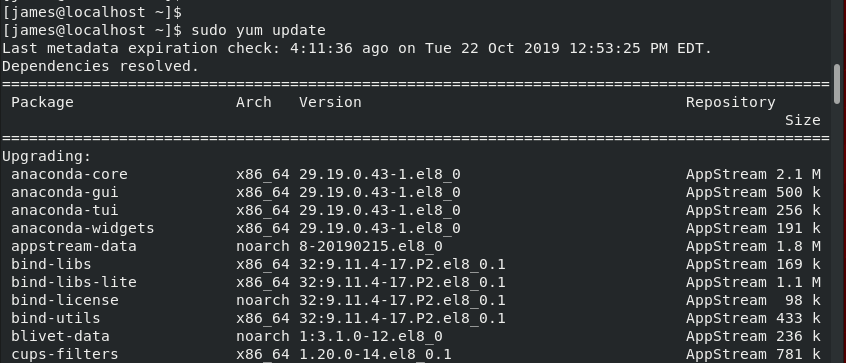
Upon successfully updating the system, let’s process and install the cockpit tool.
Step 2: Install Cockpit on CentOS 8
Installing Cockpit it quite simple and straightforward. To install, simply issue the command:
# sudo yum install cockpit
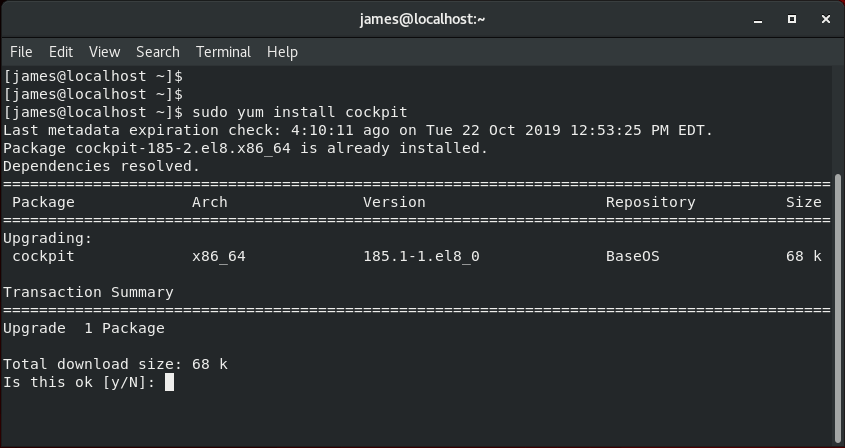
Step 3: Start and enable Cockpit
After installing Cockpit, start the cockpit service by running:
# sudo systemctl start cockpit

To confirm the status of Cockpit, run the command:
# sudo systemctl status cockpit

Also, you can check if cockpit is running by viewing the current processes running using the ps command as shown
# ps aux | grep cockpit

You can also use the netstat command as shown
# ps aux | grep cockpit

Great, Cockpit is now installed and running.
Step 4: Accessing Cockpit
To access the Cockpit web console, browse your server’s IP address as shown:
http:/server-IP:9090
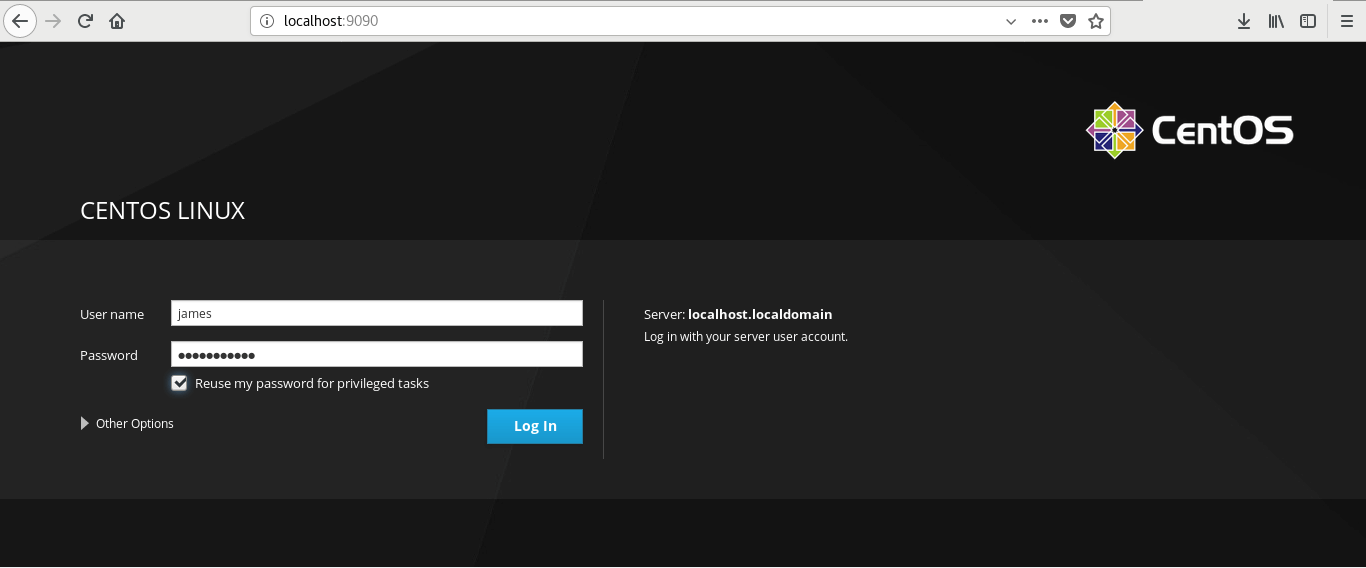
Provide your username and password and hit the Login button. Cockpit’s dashboard will thereafter be displayed as shown.
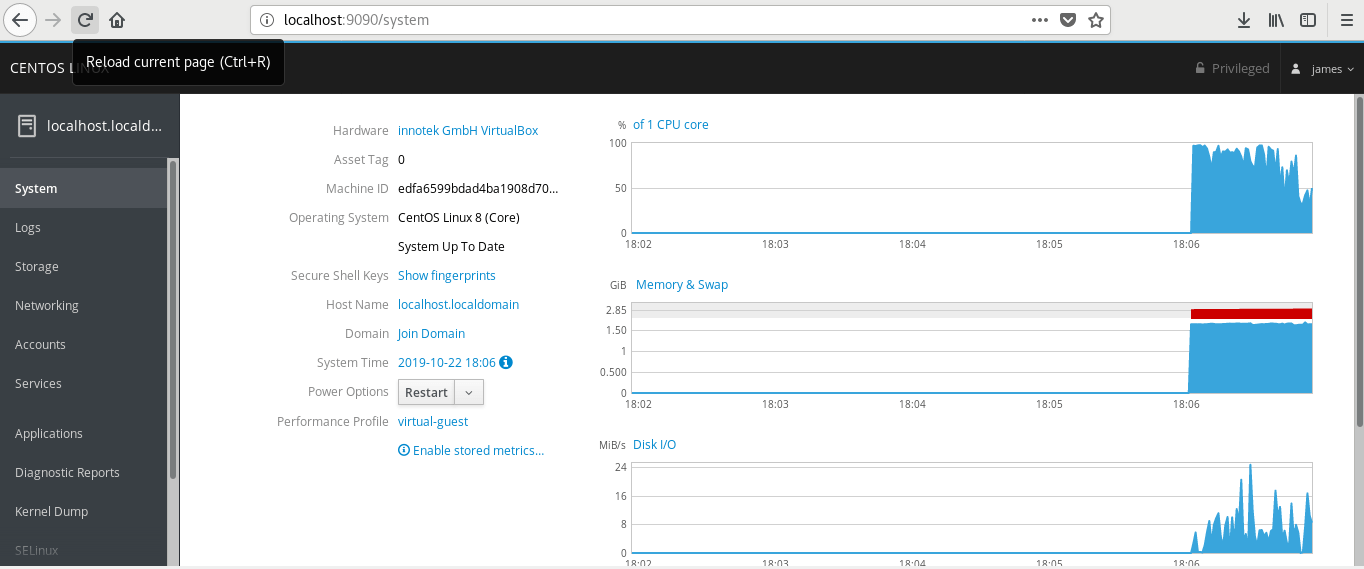
On the left sidebar is a list of things that you can access, view and configure on your system. For instance, we have selected the ‘System’ tab which gives us an overview of the system statistics such as CPU core, Memory and Swap usage and Disk usage to mention a few.
For example, to have a glance at the system logs, click on the ‘Logs‘ option as shown.

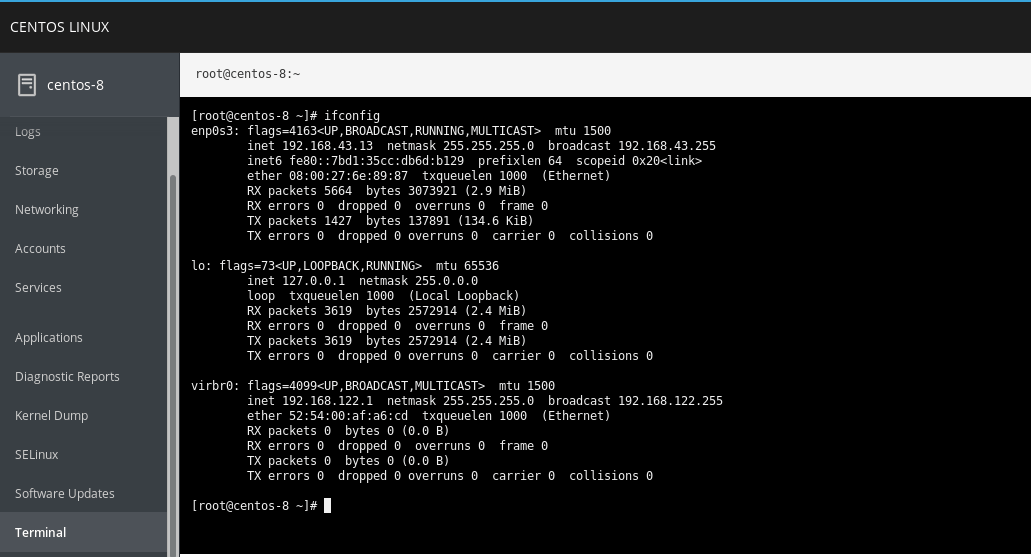
If you are not much of a GUI fan, you can still access the terminal by scrolling and clicking on the ‘terminal‘ option on the left sidebar as shown:
And that’s all for now. We do hope that you found this article informative. Your feedback is most welcome.

