We have covered quite a number of monitoring tools in the past such as Bashtop which is a command-line monitoring tool that provides a real-time analysis of your system metrics. Another equally robust and intuitive tool is Glances. Written in Python, Glances is an open-source cross-platform, command-line tool used for real-time monitoring of system metrics. It displays a myriad of system statistics on the terminal or console and even includes a web mode that allows you to monitor your system on a web browser. The Glances tool intuitively monitors metrics such as CPU and memory utilization, uptime, bandwidth utilization, running processes, Disk I/O, and filesystems to mention just but a few. In this guide, we focus on Glances – a real-time monitoring tool for Linux.
Requirements
Before getting started, ensure that you have Python3 installed
Installation
Glances tool is available in official repositories on many Linux distributions. It can be installed using your package manager.
Ubuntu/Debian based systems
On Ubuntu and Debian derivatives, run the command:
$ sudo apt install glances
CentOS/ RHEL/Fedora
For Red Hat and CentOS distributions, execute.
$ sudo dnf install glances
Install Glances using PIP
Since it’s written in Python, you can use the PIP package manager to install it as shown. For this to work, ensure pip3 is installed. You can install pip3 as shown.
$ sudo apt install python3-pip
Thereafter, use pip3 to install Glances as follows.
$ sudo pip3 install glances
Install Glances using an automated installation script
Additionally, you can install Glances by downloading and running an automated script as shown.
$ curl -L https://bit.ly/glances | /bin/bash
You can also run the script below to install Glances:
$ wget -O- http://bit.ly/glances | /bin/bash
Glances can be used in 3 different modes:
- Standalone – Monitors your local system and outputs system information in the terminal.
- Web – Monitors a single system and you can view results in a web browser
- Client-Server – Monitors multiple systems.
Let’s take a deep dive and see how you can achieve each of these modes to display system statistics.
Run Glances monitoring tool in Standalone Mode
In stand-alone mode, you can use glances to monitor your local machine. You can view the output in your terminal. Use the glances command.
$ glances
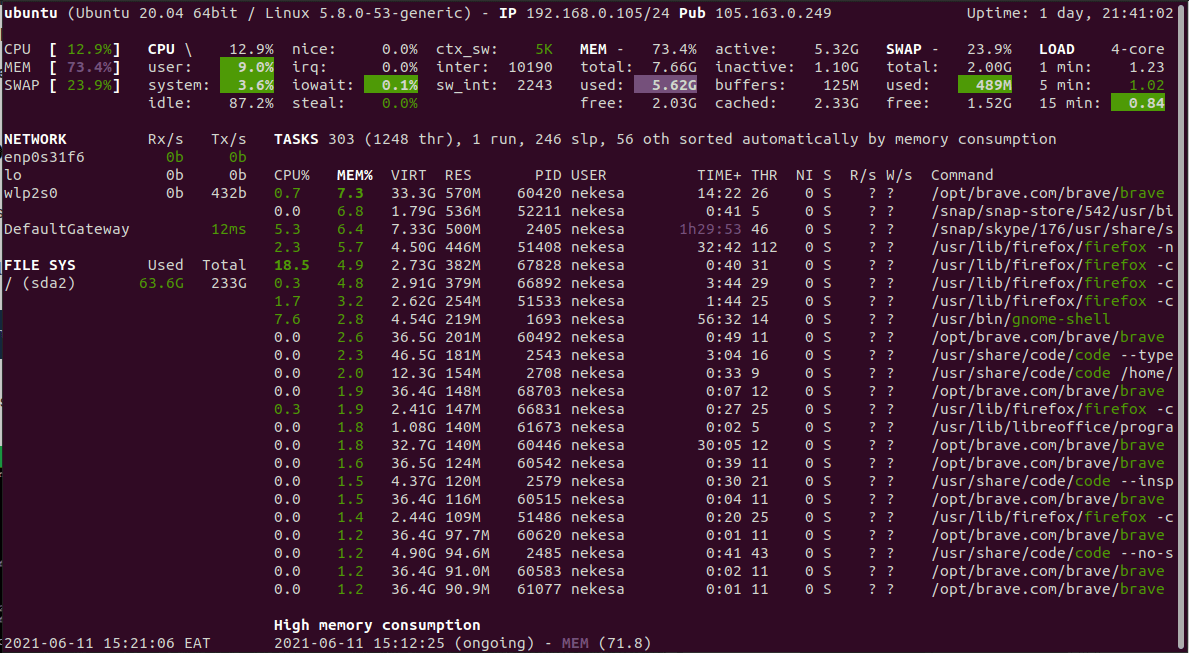
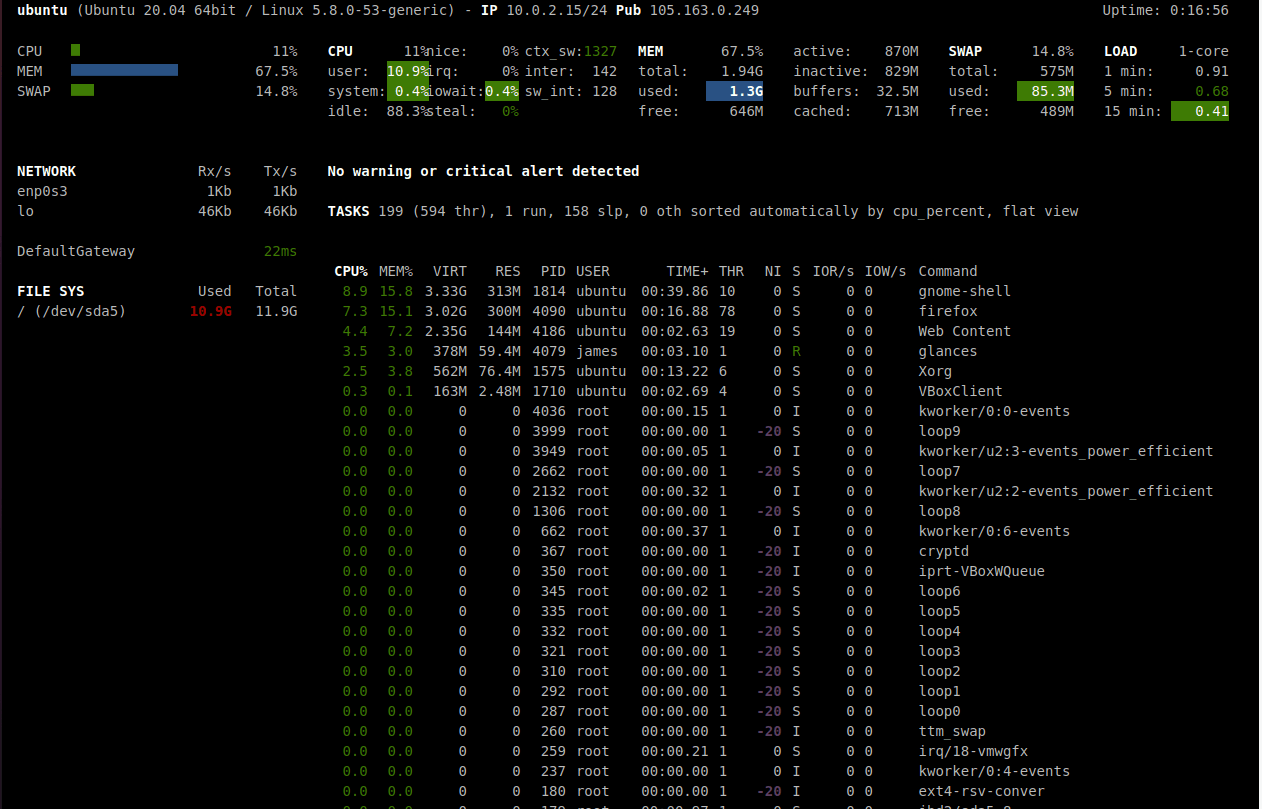
As you can see, the output provides a wealth of information about various system metrics starting off with the hostname, OS type, kernel version, private and public IP, and uptime statistics at the very top.

Run Glances in Web Mode
Glances tool also provides the functionality of rendering statistics on a web browser, instead of a terminal. The webserver runs on port 61208. To do so, run the command:
$ glances -w

The above command will output that a webserver is running. You can open your web browser to http://0.0.0.0:61208. To kill the webserver instance, use the [Ctrl]+[c] key combination.

To secure the web GUI with a password, run the following command:
$ glances -w --password
Provide your desired password . The username is ‘glances’
Define the Glances webserver password (glances username):
Password (confirm):
Do you want to save the password? [Yes/No]: n
Glances Web User Interface started on http://0.0.0.0:61208/
Run Glances in Client-Server Mode
Glances can also be used to monitor a remote computer in client-server mode. For this to succeed, you need to have glances installed on both the server and the client.
On the remote Linux system to be monitored, launch glances in server mode using the command:
$ glances -s
After starting Glances in server mode, head over to your client system run the Glances command with the -c option followed by your remote system’s IP address.
$ glances -c server-ip-address
This is going to retrieve the remote host’s metrics and render them on your terminal.
Conclusion
Monitoring your Linux server has never been easier. If you want to get system information at a glance, then this is a must-have tool.

