
An important part of administering servers is monitoring network connectivity.
There are a few tools which are simple to use. In this guide, we will discuss how to use a tool called traceroute to diagnose where a network issue may be happening.
What is Traceroute?
Basically, it is a simple tool to show the pathway to a remote server. The pathway can be anything from a website to a device on your local network.
So how do we use it?
The program is installed by default on just about every Linux distribution, to use it, we simply need to provide a website or IP address that we would like to explore. Like Below:
traceroute google.com
You should get an output like this;
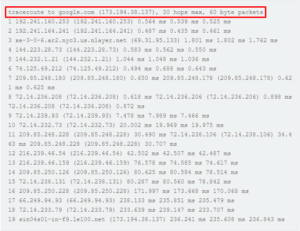
The first line tells us the conditions that traceroute is operating under.
It gives the specified host, the IP address that DNS returns for that domain, the maximum number of hops to check, and the size of the packet that will be used.
HOP refers to the number of devices, usually routers, that a piece of data travels through.
The maximum number of hops can be adjusted with the -m flag. If the host you are trying to route to is over 30 hops away, you may need to specify a larger value here. The maximum value you can set is 255.
traceroute -m 255 obiwan.scrye.net
You can adjust the size of the packet that is sent to each hop by giving the integer after the hostname:
traceroute google.com 70
traceroute to google.com (173.194.38.128), 30 hops max, 70 byte packets
1 192.241.160.254 (192.241.160.254) 0.364 ms 0.330 ms 0.319 ms
2 192.241.164.237 (192.241.164.237) 0.284 ms 0.343 ms 0.321 ms
After the first line, each subsequent line represents a “hop”, or intermediate host that your traffic must pass through to reach the computer represented by the host you specified.
Each line has the following format:
hop_number host_name (IP_address) packet_round_trip_times
Here is an example of a hop you might see:
3 nyk-b6-link.telia.net (62.115.35.101) 0.311 ms 0.302 ms 0.293 ms
The remainder of the line gives the round-trip times for a packet to the host and back again. By default, three packets are sent to each host and each attempt is appended to the end of the line. This is referred to as the packet_round_trip_times
-
- If you would like to change the number of packets that are tested against each host, you can specify a number with the
-qoption, like so;traceroute -q1 google.com
- If you would like to change the number of packets that are tested against each host, you can specify a number with the
If you would like to go without the reverse DNS lookup to speed up the trace, you can pass the -n flag:
traceroute -n google.com
traceroute to google.com (74.125.235.7), 30 hops max, 60 byte packets
 1  192.241.160.253  0.626 ms  0.598 ms  0.588 ms
 2  192.241.164.241  2.821 ms  2.743 ms  2.819 ms
 3  69.31.95.133  1.470 ms  1.473 ms  1.525 ms
If your traceroute dissolves into some asterisks (*), there is a problem with the route to the host.
    15  209.85.248.220 (209.85.248.220)  121.809 ms 72.14.239.12 (72.14.239.12)  76.941 ms 209.85.248.220 (209.85.248.220)  78.946 ms
16  72.14.239.247 (72.14.239.247)  101.001 ms  92.478 ms  92.448 ms
17  * * 209.85.250.124 (209.85.250.124)  175.083 ms
18  * * *
19  * * *
What Does a Route Issue Mean?
If your traceroute attempt stops at a particular hop or node and cannot find a route to the host, you have a problem.
While the hop where the route fails to return may be the location of the networking issue, it isn’t always that easy to diagnose.
Due to the fact that each ping represents a round-trip packet and the situation where packets often use different pathways in either direction, it may indicate a problem in a completely different, possibly closer route.
It also may be the case that the problem is with the hop directly after the last hop you see. It is difficult to diagnose the exact location of the problem unless you can get a return traceroute from that specific hop. This is usually not possible outside of your own network.
Let’s take a look at a utility called mtr which combines much of the functionality of ping and traceroute into one interface.
How To Use MTR
A dynamic alternative to the traceroute program is mtr. Combining the functionality of ping and traceroute, mtr allows you to constantly poll a remote server and see how the latency and performance changes over time.
Unlike traceroute, mtr is not installed by default on most systems. You can get it by typing the following commands.
Ubuntu/Debian:
sudo apt-get install mtr
CentOS/Fedora:
yum install mtr
Arch:
pacman -S mtr
Once it is installed, you can call it by typing:
mtr google.com
                       My traceroute  [v0.80]
traceroute (0.0.0.0)                        Tue Oct 22 20:39:42 2013
Resolver: Received error response 2. (server failure)er of fields   q
uit                         Packets               Pings
 Host                     Loss%   Snt   Last   Avg  Best  Wrst StDev
 1. 192.241.160.253        0.0%   371    0.4   0.6   0.1  14.3   1.0
 2. 192.241.164.241        0.0%   371    7.4   2.5   0.1  37.5   4.8
 3. xe-3-0-6.ar2.nyc3.us.  2.7%   371    3.6   2.6   1.1   5.5   1.1
 4. sl-gw50-nyc-.sprintli  0.0%   371    0.7   5.0   0.1  82.3  13.1
While the output may look similar, the big advantage over traceroute is that the output is constantly updated. This allows you to accumulate trends and averages, and also allows you to see how the network performance varies over time.
If you ran a traceroute, there is a possibility that the packets that were sent to each hop happened to make the trip without incident, even in a situation where the route is suffering from intermittent packet loss. The mtr utility allows you to monitor for this situation by gathering data over a wider range of time.
It is also possible to run mtr with the --report option, which returns the results of sending 10 packets to each hop.
mtr --report google.com
HOST: traceroute                  Loss%   Snt   Last   Avg  Best  Wrst StDev
  1.|-- 192.241.160.254            0.0%    10    1.5   0.9   0.4   1.5   0.4
  2.|-- 192.241.164.237            0.0%    10    0.6   0.9   0.4   2.7   0.7
  3.|-- nyk-b6-link.telia.net      0.0%    10    0.5   0.5   0.2   0.7   0.2
  4.|-- nyk-bb2-link.telia.net     0.0%    10   67.5  18.5   0.8  87.3  31.8
This can be useful when you don’t necessarily want to measure in real-time, but you want a greater range of data than traceroute provides.
Conclusion
With traceroute and mtr, you can get a sense as to which servers on your way to a specific domain or address are causing problems. This can be useful when troubleshooting an internal network, and also when trying to provide information to support members or ISPs when you are experiencing network problems.